Software and Resources
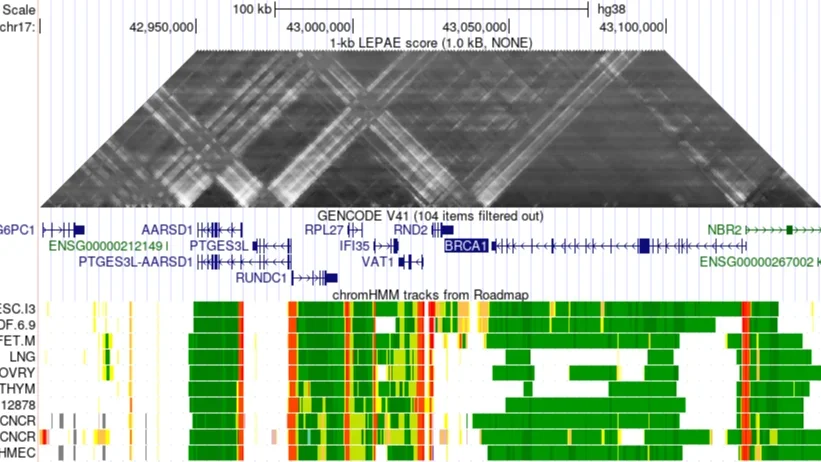
LEPAE - Learning Evidence of Pairwise Association from Epigenomic and TF binding data
Access the LEPAE project on GitHub
Citation:
Kwon SB, Ernst J.
Learning a Pairwise Epigenomic and Transcription Factor Binding Association Score Across the Human Genome.
Bioinformatics, btag024, advanced online publication.
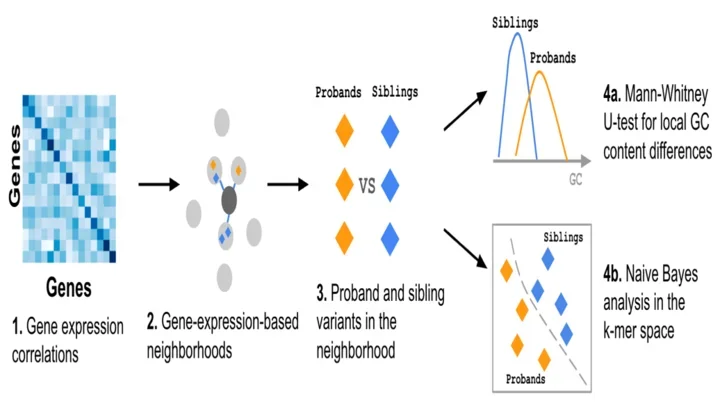
ENSAS - Expression Neighborhood Sequence Association Study
Access the ENSAS project on GitHub
Citation:
Li, R, Ernst, J.
Identifying associations of de novo noncoding variants with autism through integration of gene expression, sequence, and sex information.
Genome Biology, 26: 156, 2025.
CMImpute: cross-species and tissue imputation of species-level DNA methylation samples across mammalian species
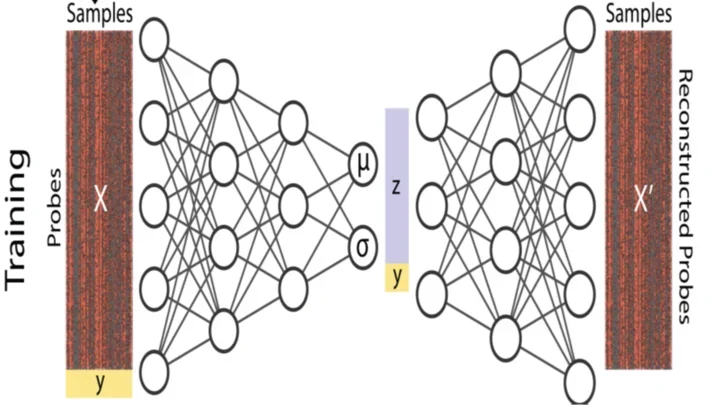
CMImpute is a method for cross-species and tissue imputation of DNA methylation samples
Access the CMImpute project on GitHub
Citation:
Maciejewski, E, Horvath, S, Ernst, J.
CMImpute: cross-species and tissue imputation of species-level DNA methylation samples across mammalian species.
Genome Biology, 26: 133, 2025.
ChromActivity: integrative epigenomic and functional characterization assay based annotation of regulatory activity across diverse human cell types
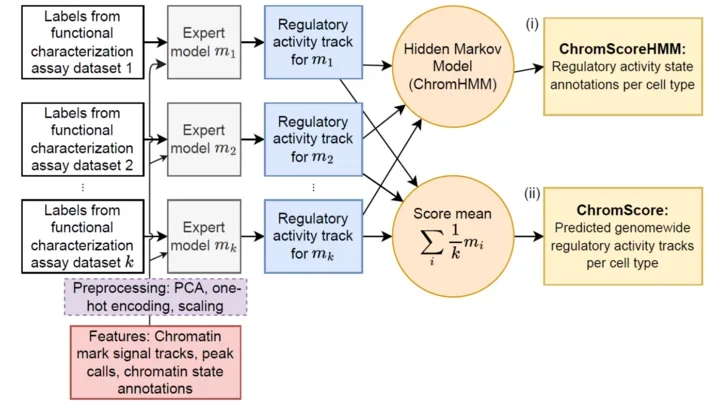
ChromActivity is a method for integrative epigenomic and functional characterization assay based annotation of regulatory activity
Access the ChromActivity project on GitHub
Citation:
Dincer TU, Ernst J.
ChromActivity: integrative epigenomic and functional characterization assay based annotation of regulatory activity across diverse human cell types.
Genome Biology. 26:123, 2025.
ChromGene: gene-based modeling of epigenomic data
ChromGene is a method for gene-based modeling of epigenomic data.
Access the ChromGene project on GitHub
Citation:
Jaroszewicz A, Ernst J.
ChromGene: gene-based modeling of epigenomic data.
Genome Biology, 24:203, 2023.
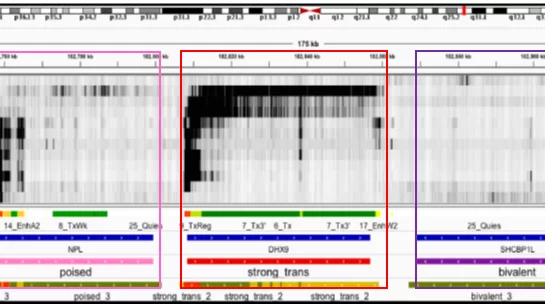
CSREP: A framework for group-wise summarization and comparison of chromatin state annotations
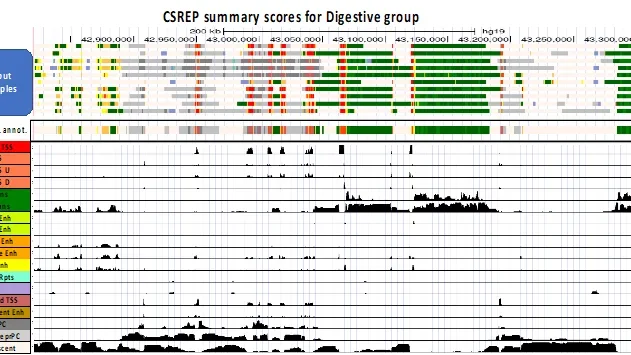
CSREP is a framework for group-wise summarization and comparison of chromatin state annotations.
Access the CSREP project on GitHub
Citation:
Vu H, Koch Z, Fiziev P, Ernst J.
A framework for group-wise summarization and comparison of chromatin state annotations.
Bioinformatics, 39:btac722, 2023.
LECIF: Learning Evidence of Conservation from Integrated Functional genomic annotations

LECIF is a supervised machine learning method that learns a genome-wide score of evidence for conservation at the functional genomics level.
Access the LECIF project on GitHub
Citation:
Kwon SB, Ernst J.
Learning a genome-wide score of human-mouse conservation at the functional genomics level.
Nature Communications, 12:2495, 2021.
CNEP: Constrained Non-Exonic Predictor
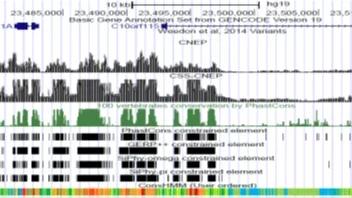
CNEP is software for predicting constrained-non exonic bases from large scale epigenomic and transcription factor binding data.
Access the CNEP project on GitHub
Citation:
Grujic O, Phung TN, Kwon SB, Arneson A, Lee Y, Lohmueller KE, Ernst J.
Identification and characterization of constrained non-exonic bases lacking predictive epigenomic and transcription factor binding annotations.
Nature Communications, 11:6168, 2020.
χ-CNN: integrative approach for fine-mapping chromatin interactions
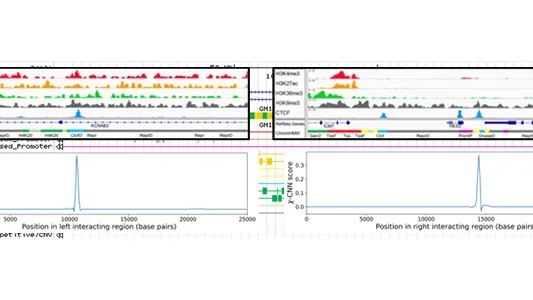
χ-CNN is software that integrates epigenomic and transcription factor binding data with more coarsely mapped chromatin interactions to fine-map the most likely sources of interactions.
Access the χ-CNN project on GitHub
Citation:
Jaroszewicz A, Ernst J.
An Integrative Approach for Fine-Mapping Chromatin Interactions.
Bioinformatics, 36:1704-1711, 2020.
ConsHMM: systematic discovery of conservations states and single-nucleotide genome annotation

ConsHMM is software for discovering conservations states and annotating genomes at single nucleotide resolution based on them.
Access the ConsHMM project on GitHub
Citation:
Arneson A, Ernst J
Systematic discovery of conservation states for single-nucleotide annotation of the human genome.
Communications Biology, 248, 2019.
ChromTime: modeling spatio-temporal dynamics of chromatin marks
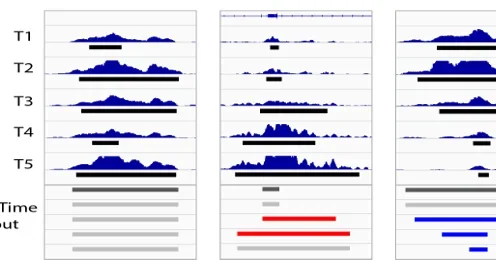
ChromTime is software for modeling the spatio-temporal dynamics of chromatin marks over time allowing systematic detection of expansions, contractions, and steady regions of chromatin marks over time.
Access the ChromTime project on GitHub
Citation:
Fiziev P, Ernst J
ChromTime: modeling spatio-temporal dynamics of chromatin marks.
Genome Biology, 19:109, 2018.
SHARPR: Systematic High-resolution Activation and Repression Profiling with Reporter-tiling
SHARPR is software for analyzing Massively Parallel Reporter Assay tiling designs allowing mapping at high resolution activating and repressive nucleotides across thousands of regulatory regions.
Citation:
Ernst J, Melnikov A, Zhang X, Wang L, Rogov P, Mikkelsen T, Kellis M.
Genome-scale high-resolution mapping of activating and repressive nucleotides in regulatory regions.
Nature Biotechnology, 34:1180-1190, 2016.
SHARPR Documentation and Instructions
- Interactive browser of all tiled regions from Ernst et al 2016
- SHARPR software (v1.0.2; version log)
- SHARPR manual
- Quick instructions on running SHARPR on example data:
1. Install Java 1.6 or later if not already installed.
2. Unzip the file SHARPR.zip.
3. To run SHARPR on the sample data to infer base level predictions directly from count data type from the SHARPR directory:
java -mx2000M -jar SHARPR.jar ExecuteAll EXAMPLE/HepG2_ScaleUpDesign1_minP_mRNA_Rep1.counts,EXAMPLE/HepG2_ScaleUpDesign1_minP_mRNA_Rep2.counts EXAMPLE/ScaleUpDesign1_minP_Plasmid.counts,EXAMPLE/ScaleUpDesign1_minP_Plasmid.counts 3 145 5 31 EXAMPLE/basepredictions_HepG2_ScaleUpDesign1_minP.txt - SHARPR is described in:
Ernst J#, Melnikov A, Zhang X, Wang L, Rogov P, Mikkelsen T, Kellis M#.
Genome-scale high-resolution mapping of activating and repressive nucleotides in regulatory regions.
Nature Biotechnology, 34:1180-1190, 2016. - Files specific to the Ernst et al manuscript:
- Pilot (LargeStep) Raw Counts and Design Files
- Pilot (LargeStep) Normalized Data Tables
- Scale-up (SmallStep) Raw Counts and Design Files
- Scale-up (SmallStep) Sharpr-MPRA Regulatory Activity Scores: HepG2 and K562
- Scale-up (SmallStep) Browser Files (BigWig - hg19): HepG2 combinedP, K562 combinedP, HepG2 minP, K562 minP, HepG2 SV40P, K562 SV40P
- Scale-up (SmallStep) Image Files: HepG2 Images, K562 Images
- Data in GEO
- Subscribe to a mailing for announcements of new versions of SHARPR
- SHARPR source code on GitHub. SHARPR makes use of The Apache Commons Mathematics Library (v3.3).
- Funding for SHARPR provided by NIH grants R01ES024995, U01HG007912 and U01MH105578 (J.E.), R01HG006785 (T.S.M.), R01GM113708, U01HG007610, R01HG004037, U54HG006991 and U41HG007000 (M.K.), an NSF CAREER Award #1254200, and an Alfred P. Sloan Fellowship (J.E.).
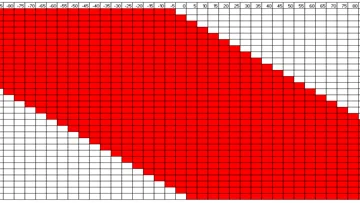
ChromImpute: Large-scale epigenome imputation

ChromImpute is software for large-scale systematic epigenome imputation. ChromImpute takes an existing compendium of epigenomic data and uses it to predict signal tracks for mark-sample combinations not experimentally mapped or to generate a potentially more robust version of data sets that have been mapped experimentally. ChromImpute bases its predictions on features from signal tracks of other marks that have been mapped in the target sample and the target mark in other samples with these features combined using an ensemble of regression trees.
Citation:
Ernst J, Kellis M.
Large-scale imputation of epigenomic datasets for systematic annotation of diverse human tissues.
Nature Biotechnology, 33:364-376, 2015.
ChromImpute Documentation and Instructions
- ChromImpute software (v1.0.5; version log)
- ChromImpute manual
- Example data chr21 only of Roadmap Epigenomics compendium (~1GB)
- Quick instructions on running ChromImpute on the example data (chr21 of eight primary marks from the Roadmap Epigenomics project):
1. Install Java 1.6 or later if not already installed.
2. Unzip the file ChromImpute.zip.
3. Unzip the file EXAMPLE.zip and place in the ChromImpute directory.
4. From a command line go to the directory in which ChromImpute.jar is installed.
5. To try out ChromImpute imputing H3K9ac for sample E034 (Primary T cells from peripheral blood) based on pre-computed predictors enter the command:
java -mx4000M -jar ChromImpute.jar Apply EXAMPLE/CONVERTEDDATADIR EXAMPLE/DISTANCEDIR EXAMPLE/PREDICTORDIR EXAMPLE/tier1_samplemarktable.txt EXAMPLE/hg19sizes_chr21.txt EXAMPLE/OUTPUTDATA E034 H3K9ac
In ~20min this will generate a chr21_impute_E034_H3K9ac.wig.gz file in the directory EXAMPLE/OUTPUTDATA
- In general the following main steps are applied to generate an imputation. The manual provides more detail and discusses additional options including parallelization options to make some steps more efficient.
1. If the input signal data is not already available at the desired resolution, default assumed to be 25bp, then use the Convert command to convert the data to the desired resolution. For the provided the example data, the data is already provided at the desired resolution, but here is an example of a command that could be used to covert the data to the desired resolution if unconverted data was provided:
java -mx4000M -jar ChromImpute.jar Convert EXAMPLE/INPUTDATADIR EXAMPLE/tier1_samplemarktable.txt EXAMPLE/hg19sizes_chr21.txt EXAMPLE/CONVERTEDDATADIR
The data in the INPUTDATADIR directory should be in .bedgraph or .wig format. Each file is as an entry in the samplemarktable_example.txt. The file hg19sizes_chr21.txt specifies the chromosome(s) to include and their lengths and the output is written to the CONVERTEDDATADIR directory.
2. Global distance between datasets should be computed with the ComputeGlobalDist command. For generating the distances included in the example data the following command was run:
java -mx4000M -jar ChromImpute.jar ComputeGlobalDist EXAMPLE/CONVERTEDDATADIR EXAMPLE/tier1_samplemarktable.txt EXAMPLE/hg19sizes_chr21.txt EXAMPLE/DISTANCEDIR
3. Generate the features for the training with the GenerateTrainData command. This is done separately for each mark of interest. For generating the H3K9ac training data for the example data this was done with the command:
java -mx4000M -jar ChromImpute.jar GenerateTrainData EXAMPLE/CONVERTEDDATADIR EXAMPLE/DISTANCEDIR EXAMPLE/tier1_samplemarktable.txt EXAMPLE/hg19sizes_chr21.txt EXAMPLE/TRAINDATA H3K9ac
4. Generate the trained predictors for a specific mark in a specific sample type of interest with the Train command. For generating the predictors for imputing H3K9ac in E034 for the example data this was done with the command:
java -mx4000M -jar ChromImpute.jar Train EXAMPLE/TRAINDATA EXAMPLE/tier1_samplemarktable.txt EXAMPLE/PREDICTORDIR E034 H3K9ac
5. Generate the imputed signal track with Apply command for the desired mark in the desired sample. To generate the imputed signal track for H3K9ac for sample E034 the command is:
java -mx4000M -jar ChromImpute.jar Apply EXAMPLE/CONVERTEDDATADIR EXAMPLE/DISTANCEDIR EXAMPLE/PREDICTORDIR EXAMPLE/tier1_samplemarktable.txt EXAMPLE/hg19sizes_chr21.txt EXAMPLE/OUTPUTDATA E034 H3K9ac
- The observed compendium of data and imputed signal data, peak calls on imputed data, and chromatin states based on imputed data (hg19) can be found linked from Integrative Analysis of 111 reference human epigenomes.
- The full roadmap epigenomics observed data already converted in a form to be run in ChromImpute with necessary files can be found on the Integrative Analysis of 111 reference human epigenomes.
- ChromImpute is described in:
Ernst J, Kellis M. Large-scale imputation of epigenomic datasets for systematic annotation of diverse human tissues. Nature Biotechnology, 33:364-376, 2015. - Subscribe to a mailing list for announcements of new versions.
- ChromImpute source code is available on GitHub.
- Please contact Jason Ernst at jason.ernst@ucla.edu with any questions, comments, or bug reports.
- Funding for ChromImpute provided by NSF CAREER Award #1254200 and an Alfred P. Sloan Fellowship to J.E. and by NIH grants RC1HG005334 and R01HG004037 to M.K.
ChromHMM: Chromatin state discovery and characterization
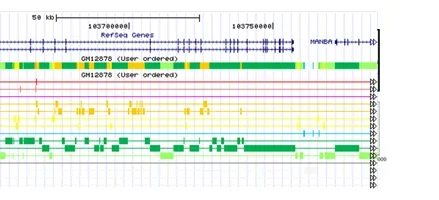
ChromHMM is software for learning and characterizing chromatin states. ChromHMM can integrate multiple chromatin datasets such as ChIP-seq data of various histone modifications to discover de novo the major re-occuring combinatorial and spatial patterns of marks. ChromHMM is based on a multivariate Hidden Markov Model that explicitly models the presence or absence of each chromatin mark. The resulting model can then be used to systematically annotate a genome in one or more cell types. By automatically computing state enrichments for large-scale functional and annotation datasets ChromHMM facilitates the biological characterization of each state. ChromHMM also produces files with genome-wide maps of chromatin state annotations that can be directly visualized in a genome browser.
Citation:
Ernst J, Kellis M.
ChromHMM: automating chromatin-state discovery and characterization.
Nature Methods, 9:215-216, 2012.
ChromHMM Documentation and Instructions
- ChromHMM software v1.25 (version log)
- ChromHMM manual
Quick instructions on running ChromHMM:
1. Install Java 1.6 or later if not already installed.
2. Unzip the file ChromHMM.zip
3. To try out ChromHMM learning a 10-state model on the sample data enter from a command line in the directory with the ChromHMM.jar file the command:
java -mx1600M -jar ChromHMM.jar LearnModel SAMPLEDATA_HG18 OUTPUTSAMPLE 10 hg18
After termination in ~5-10 minutes a file in OUTPUTSAMPLE/webpage_10.html will be created showing output images and linking to all the output files created. If a web browser is found on the computer the webpage will automatically be opened in it.
In general binarized input for the LearnModel command can be generated by first running the BinarizeBed command on bed files with coordinates of aligned reads or the BinarizeBam command on bam files with the coordinates of aligned reads.
- The ChromHMM software is described in:
Ernst J, Kellis M. ChromHMM: automating chromatin-state discovery and characterization. Nature Methods, 9:215-216, 2012. - A protocols paper on using ChromHMM is available here:
Ernst J, Kellis M. Chromatin-state discovery and genome annotation with ChromHMM. Nature Protocols, 12:2478-2492, 2017. - Here are links to some existing ChromHMM annotations in hg19 available for 127 Reference Epigenomes (Roadmap Epigenomics), 9-ENCODE cell types (from Ernst et al, Nature 2011), and 6-ENCODE cell types (from ENCODE Integrative Analysis).
- A liftover of the hg19 annotations to hg38 for the 127 Reference Epigenomes (Roadmap Epigenomics).
- ChromHMM annotations based on a full stack model of the Roadmap Epigenomics data providing a universal chromatin state annotation of the human genome is described in:
Vu H, Ernst J.
Universal annotation of the human genome through integration of over a thousand epigenomic datasets.
Genome Biology, 23:9, 2022. - Contact Jason Ernst at jason.ernst@ucla.edu with any questions, comments, or bug reports.
- Subscribe to a mailing list for announcements of new versions
- ChromHMM is released under a GPL 3 license.
- ChromHMM source code is available on GitHub.
- Funding for ChromHMM provided by NSF Postdoctoral Fellowship 0905968 to JE and grants from the National Institutes of Health (NIH 1-RC1-HG005334 and NIH 1 U54 HG004570).
DREM: Dynamic Regulatory Events Miner
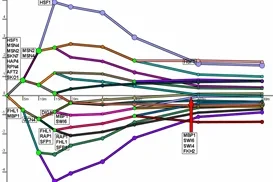
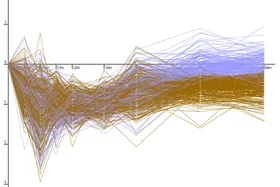
The Dynamic Regulatory Events Miner (DREM) allows one to model, analyze, and visualize transcriptional gene regulation dynamics. The method of DREM takes as input time series gene expression data and static or dynamic transcription factor-gene interaction data (e.g. ChIP-seq, ChIP-chip data), and produces as output a dynamic regulatory map. The dynamic regulatory map highlights major bifurcation events in the time series expression data and transcription factors potentially responsible for them.
Citation:
Ernst J, Vainas O, Harbison CT, Simon I, and Bar-Joseph Z.
Reconstructing dynamic regulatory maps.
Nature-EMBO Molecular Systems Biology, 3:74, 2007.
View a list of papers using DREM
STEM: Short Time-series Expression Miner
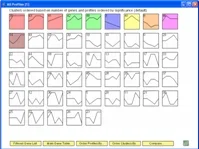
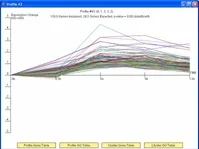
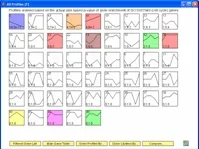
The Short Time-series Expression Miner (STEM) is a Java program for clustering, comparing, and visualizing short time series gene expression data from microarray experiments (~8 time points or fewer). STEM allows researchers to identify significant temporal expression profiles and the genes associated with these profiles and to compare the behavior of these genes across multiple conditions. STEM is fully integrated with the Gene Ontology (GO) database supporting GO category gene enrichment analyses for sets of genes having the same temporal expression pattern. STEM also supports the ability to easily determine and visualize the behavior of genes belonging to a given GO category or user defined gene set, identifying which temporal expression profiles were enriched for these genes. (Note: While STEM is designed primarily to analyze data from short time course experiments it can be used to analyze data from any small set of experiments which can naturally be ordered sequentially including dose response experiments.)
Citation:
Ernst J, Bar-Joseph Z
STEM: a tool for the analysis of short time series gene expression data.
BMC Bioinformatics, 7:191, 2006.
View a list of papers using STEM
SEREND: SEmi-supervised REgulatory Network Discoverer
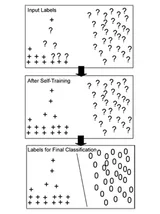
The SEmi-supervised REgulatory Network Discoverer (SEREND) is a semi-supervised learning method that uses a curated database of verified transcriptional factor-gene interactions, DNA sequence binding motifs, and a compendium of gene expression data in order to make thousands of new predictions about transcription factor-gene interactions, including whether the transcription factor activates or represses the gene.
Citation:
Ernst J, Beg QK, Kay KA, Balazsi G, Oltvai ZN, Bar-Joseph Z.
A Semi-Supervised Method for Predicting Transcription Factor-Gene Interactions in Escherichia coli.
PLoS Computational Biology 4: e1000044, 2008.